Covered-call ETFs and return of capital: how to tell income from your own money coming back
Updated October 26, 2026
A covered-call ETF sells call options on what it holds and pays out the premium. It trades away some upside for income, and yields of 10 %, 15 % or more are common. The fair question isn't "is the yield real" — the cash is real — but how much of it is income, and how much is your own capital being handed back.
What return of capital is — and isn't
Return of capital (ROC) is a tax label. In Canada it's reported on the T3 slip after the year ends. In a non-registered account it isn't taxed when you receive it; it lowers your adjusted cost base, so you pay more capital gains tax when you sell.
ROC on its own says little about whether a fund is eroding. Option premium is often labelled ROC even when the fund earns what it pays out. What matters is the price: a fund that pays out more than it earns in total has to give up price to do it.
How Income Viz checks it
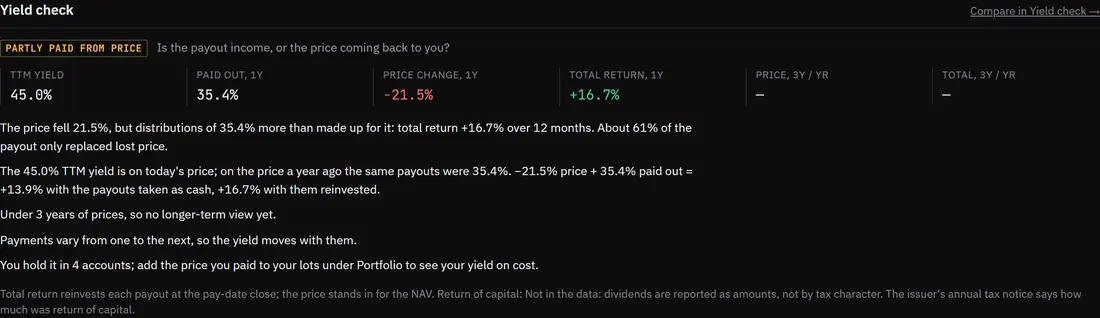
For each fund, over the last 12 months, using its closing prices and the payouts it made:
- Price change from a year ago to the last close.
- Payouts as a % of the price a year ago, so they add up with the price change.
- Total return with every payout reinvested at the pay-date price.
- Its index over the same 12 months: for common option-income funds, the index they write calls on — QDTE, JEPQ and QYLD against the Nasdaq-100 (QQQ), XDTE, JEPI and SPYI against the S&P 500 (SPY), RDTE and RYLD against the Russell 2000 (IWM), ZWB against Canadian banks (ZEB). Other funds are set against the broad market where they're listed: the S&P 500 for US listings, the S&P/TSX 60 (XIU) for Canadian ones.
The verdict follows from those numbers, nothing else:
- Price held: the price didn't fall, so the payouts came on top.
- Partly paid from price: the price fell, but the payouts more than made up for it — total return is still positive. The page says what share of the payouts only replaced lost price.
- Paid from price: the payouts didn't cover the price drop — total return is zero or negative.
It also shows the 3-year yearly rates of price and total return, which say more than one year can.
What the check can't tell you
- How much was return of capital. The tax label isn't in market data until the year's slips come out, and the page says so rather than guessing.
- Every fund's own index. Funds we haven't matched to an index are set against the broad market where they're listed. A Canadian-listed Nasdaq-100 fund, for example, is shown against the TSX 60 (its index trades in US dollars), so compare it with the Nasdaq-100 yourself.
- A full cycle. One year can be a bear market or a rally. Covered-call funds lag in strong rallies and fall almost as much in sell-offs; judge them over 3–5 years.
- What you do with the cash. The total return assumes reinvesting; if you spend the payouts, a falling price is what you're spending.
Our view
A high yield isn't fake, but it isn't free. Covered-call ETFs turn some of a market's future gains into cash today. That can suit someone who wants steady income and spends it knowingly, and it tends to work best in flat or choppy markets. It's a problem when the payout is mistaken for extra return: if the price slowly erodes, the income shrinks with it. The test we'd use is the fund's total return against its own index over a full cycle, and whether the price is holding up enough for the income you need. The yield check is the first look; it isn't advice.